What is Rug Plot
A rug Plot is a type of plot of data for a single quantitative variable, displayed as marks along an axis. It is used to visualise the distribution of the data.
Rug Plot is generally used in a combination with 2-D scatter plots by placing a rug plot for x values along the x-axis and for y values along the y-axis.
Rug Plot perpendicular marker looks like tassels along the edges of the rectangular "rug" of the scatter plot.
It generally plots marginal distribution by drawing ticks along the x-axis and y-axis.
This function is intended to complement other plots by showing the location of individual observations in an unobtrusive way.
Rug Plot Syntax
sns.rugplot(x=None, *, height=0.025, axis=None, ax=None,
data=None, y=None, hue=None, palette=None, hue_order=None,
hue_norm=None, expand_margins=True, legend=True, a=None, **kwargs)
Parameter:
- x,y: x and y are variables that specify the position along the x and y-axis.
- height: It specifies the portion of the axis covered by each rug element.
- axis: It specifies the axis on which the rug element has to be plotted.
- ax: It is pre-existing axes for the plot.
- data: It input the data structure for which the rug has to be plotted.
- hue: It is a semantic variable that is mapped to determine the color of the plot elements
- palette: It is used to choose color which is to be used for plotting.
- expand_margins: It is a boolean value. If it is True, it increases the axes margins by the height of the rug to avoid overlap with other elements.
- legend: It is a boolean value. If it is False, it does not add a legend for semantic variables.
Example: sns rugplot
Import the important libraries.
import seaborn as sns
import matplotlib.pyplot as plt
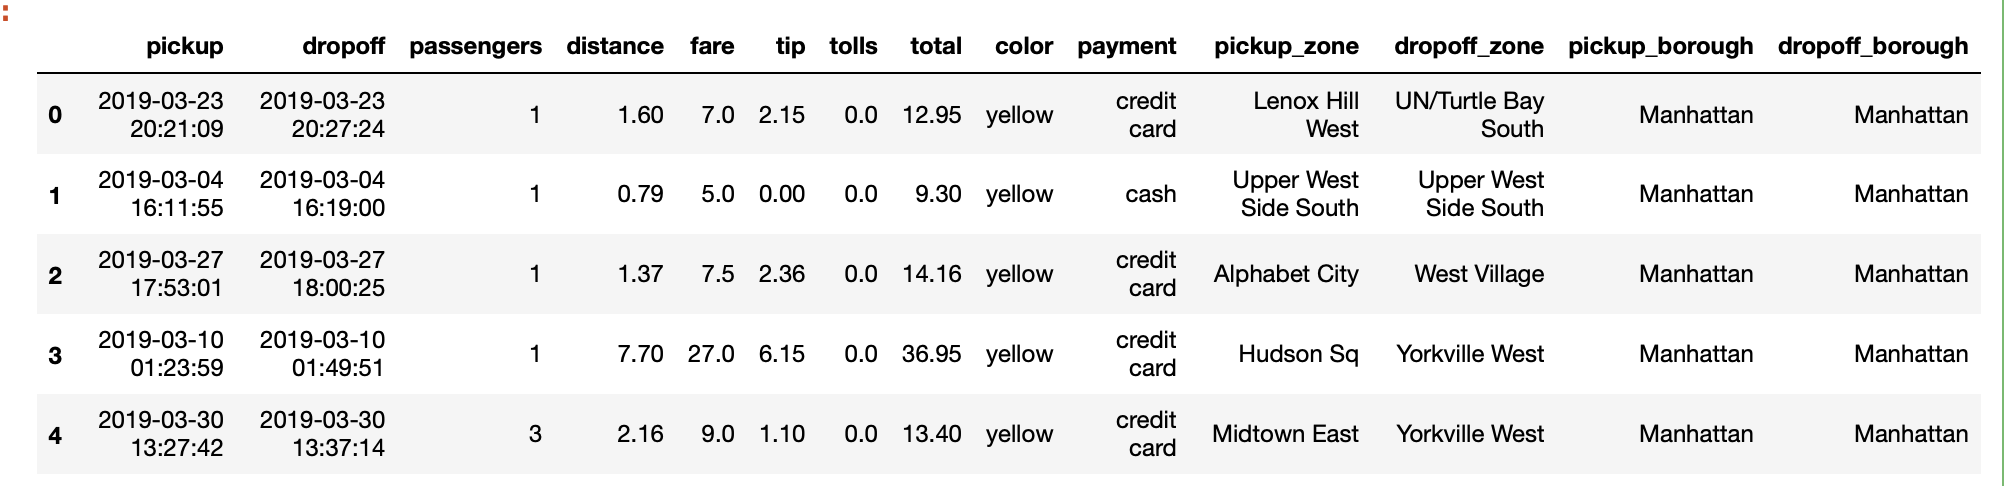
Load the dataset which is to be used for plotting
data = sns.load_dataset("taxis")
data.head(5)
Output
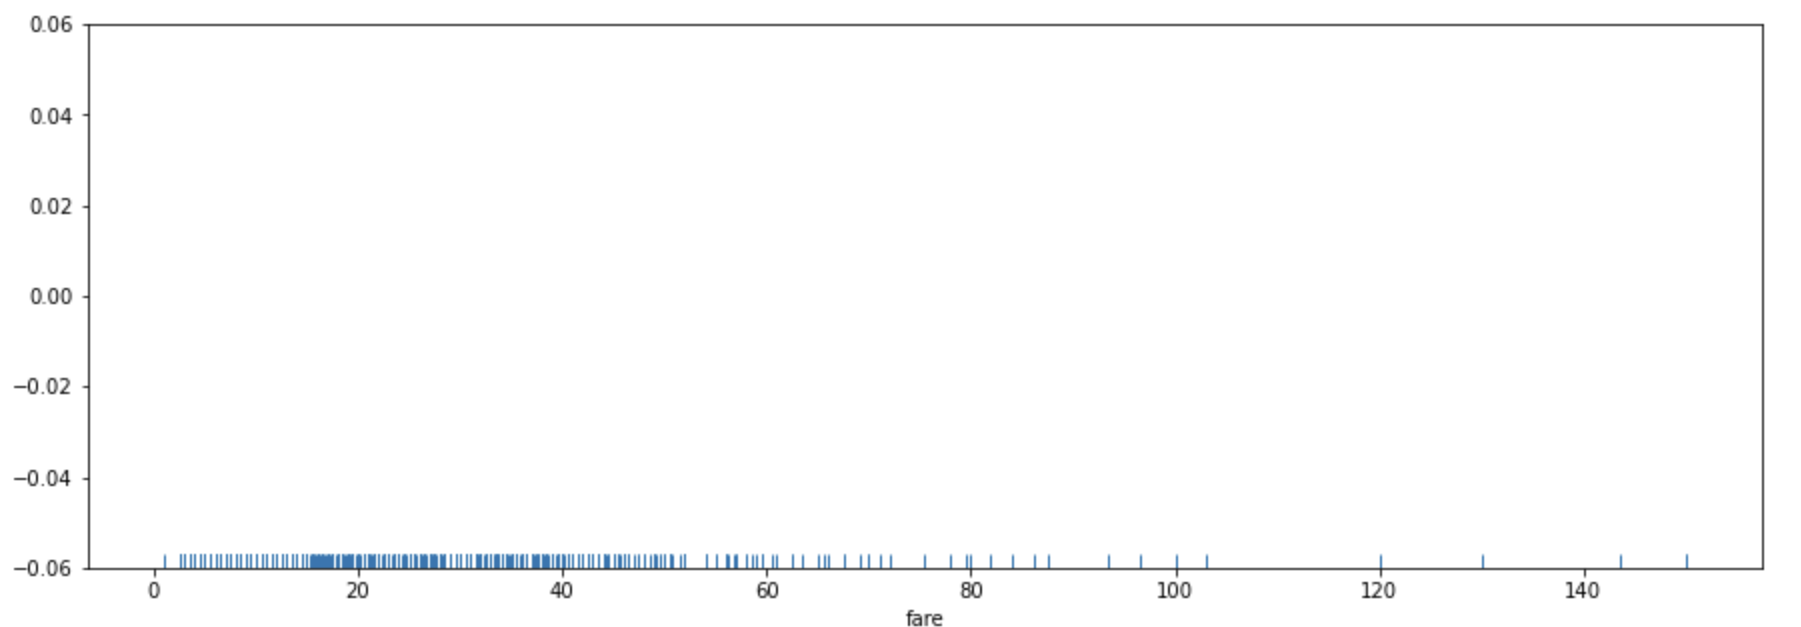
Example: For a one variable
#A basic rug plot for one variable
plt.figure(figsize=(15,5))
sns.rugplot(data=data, x ="fare")
plt.show()
Output:
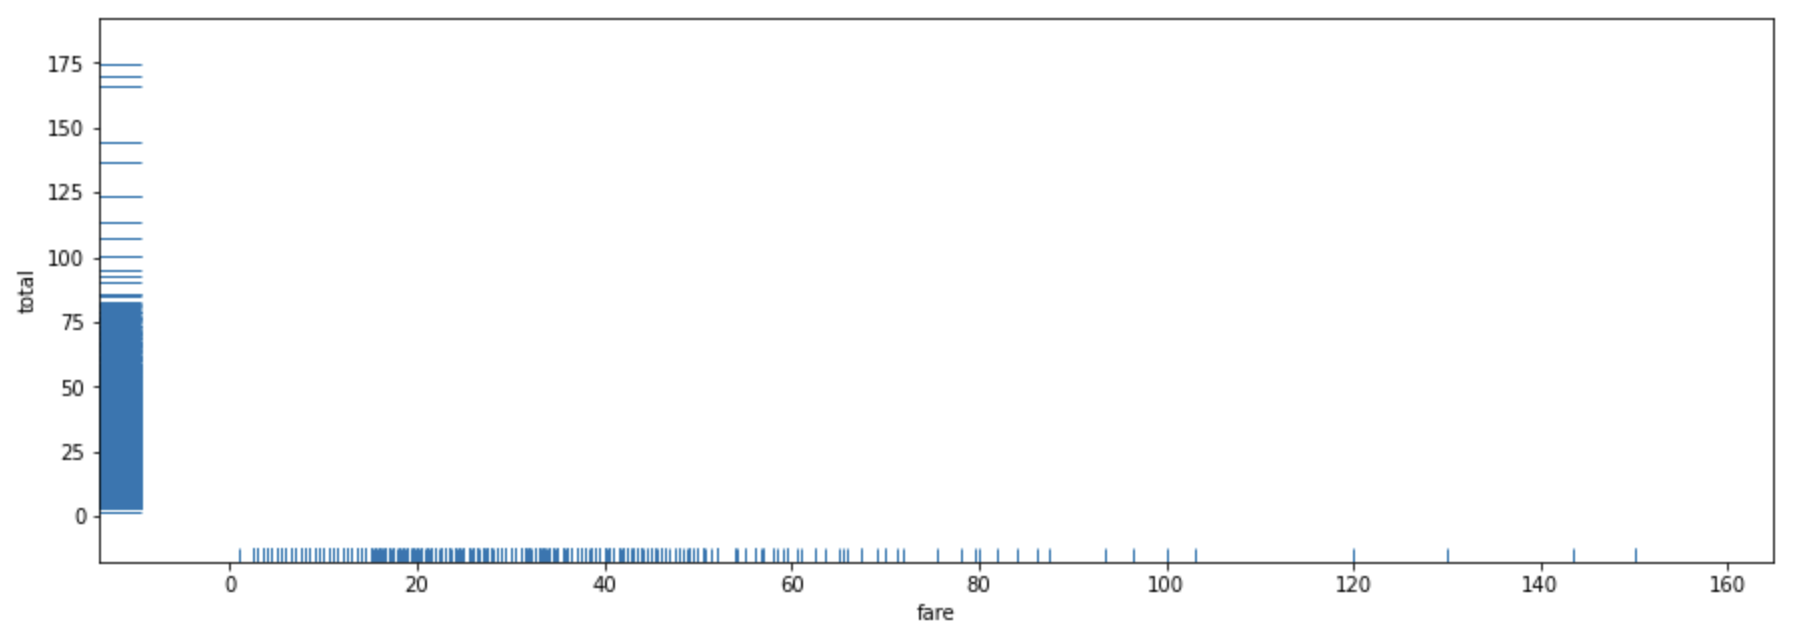
Example: Create two variable rug plot
#A basic rug plot for two variable
plt.figure(figsize=(15,5))
sns.rugplot(data=data, x ="fare",y="total")
plt.show()
Output:
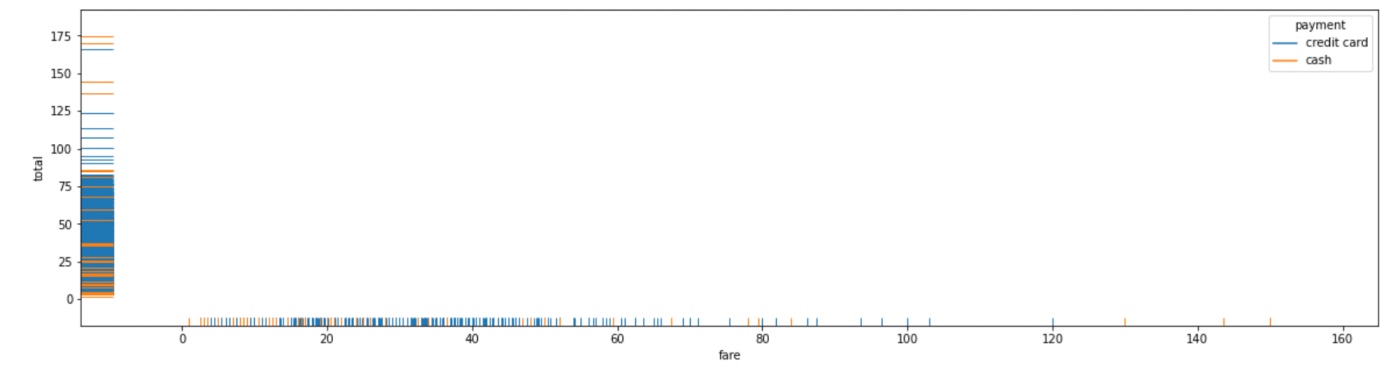
Example: Group by categorial value
#grouping it by categorial value using hue
plt.figure(figsize=(20,5))
sns.rugplot(data=data, x ="fare",y="total",hue='payment')
plt.show()
Output:
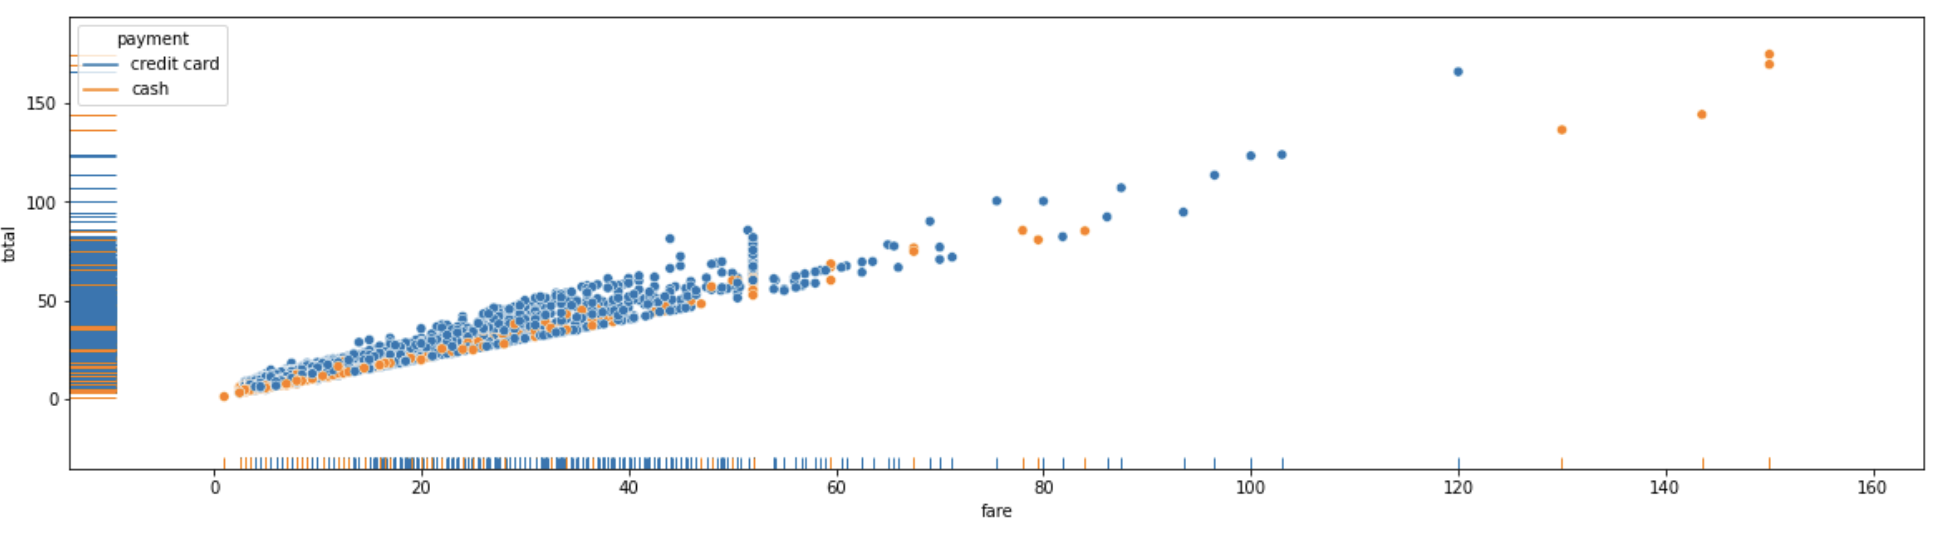
Example: Combining RUG Plot with Scatter Plot
#with a SCATTER PLOT
plt.figure(figsize=(20,5))
sns.scatterplot(data=data, x ="fare",y="total",hue='payment')
sns.rugplot(data=data, x ="fare",y="total",hue='payment')
plt.show()
Output:
- Log in to post comments