Seaborn is a python library that is used for data visualization based on Matplotlib. It has a high-level interface for attractive and informative statistical graphics.
Seaborn module along with matplotlib module is used for depicting the distplot with different variations of it.
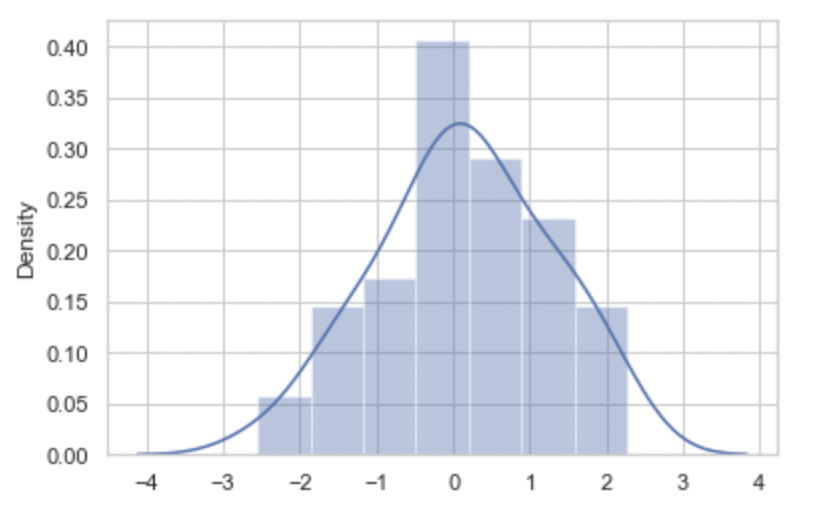
The distplot shows a histogram with a line on it. It can depict the variation in the data distribution. A distplot plots a univariate distribution of observations and visualize it through a histogram.
Creating a Distplot
The seaborn.distplot() function is used to plot the displot. It represents the data distribution of a variable against the density distribution.
Syntax
seaborn.distplot()Examples
#importing the library
import seaborn as sns
import numpy as np
import matplotlib.pyplot as plt

# setting the background style of the plot
sns.set_theme(); np.random.seed(0)
sns.set_style('whitegrid')

#generate random data values
a=np.random.randn(50)
x=sns.distplot(a)
plt.show()
Output:
Note: This distplot is a deprecated function and will be removed in a future version.Therefore please adapt your code to use either displot() or histplot() functions.
- Log in to post comments