In addition to heat map, another commonly used matrix plot is the cluster map. The cluster map basically uses Hierarchical Clustering to cluster the rows and columns of the matrix.
Let's plot a cluster map for the number of passengers who traveled in a specific month of a specific year. Execute the following script:
data = dataset.pivot_table(index='month', columns='year', values='passengers')
sns.clustermap(data)
To plot a cluster map, clustermap function is used, and like the heat map function, the dataset passed should have meaningful headers for both rows and columns. The output of the script above looks like this:
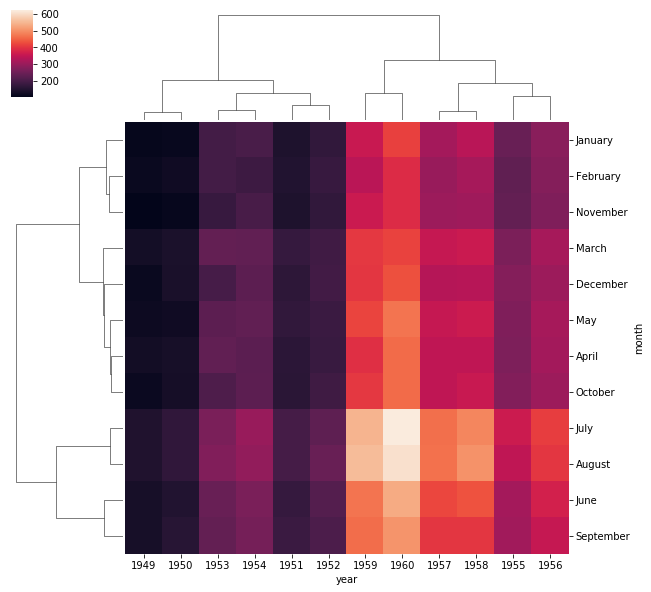
In the output, you can see months and years clustered together on the basis of number of passengers that traveled in a specific month.
Example: Normalize the data within the rows:
g = sns.clustermap(iris, z_score=0, cmap="vlag")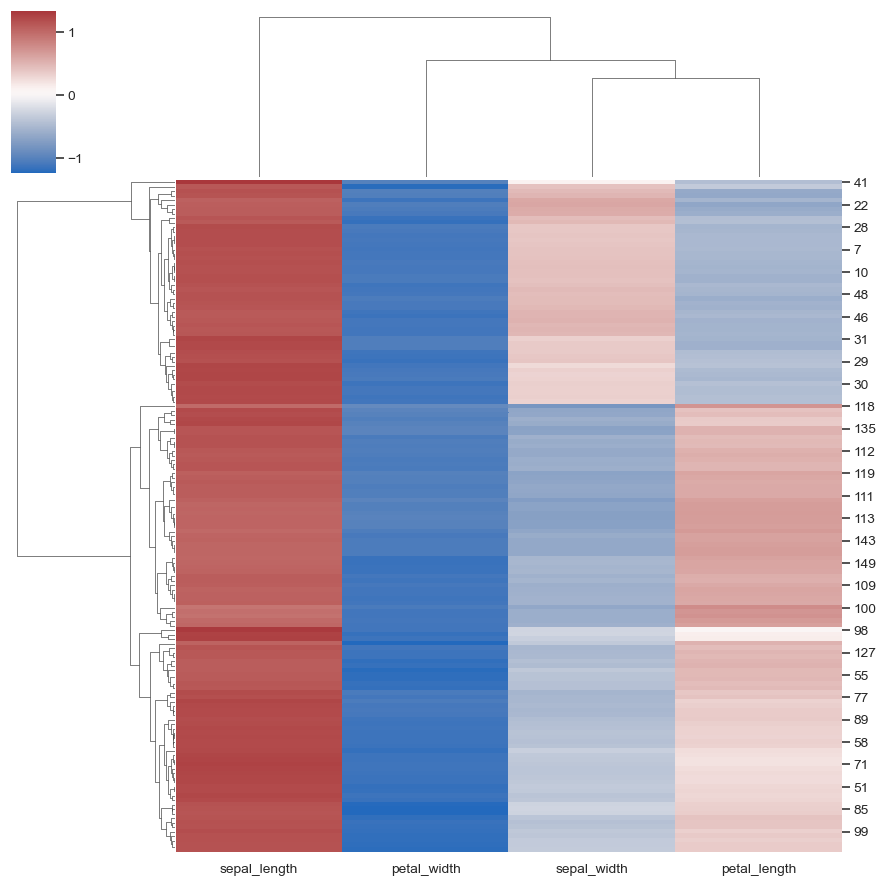
- Log in to post comments