Point plot is used to plot point estimates and confidence intervals using scatter plot glyphs.
Point plot is used for representing an estimate of central tendency for a numeric variable by the position of scatter plot points and provides some indication of the uncertainty around that estimate using error bars.
This plot always treats one of the variables as categorical and draws data for an ordinal position on a relevant axis even, if the data is of the numerical type.
Point plots are considered more useful for comparing the different levels between one or more categorical values. There is a line joining each point from the same level of the hue level which shows the interaction between two categorical variables which is easier for us than comparing the heights of several groups of points or bars.
Syntax
seaborn.pointplot(x=None, y=None, hue=None, data=None, order=None,hue_order=None,
estimator=<function mean at 0x00000193E305E828>, ci=95, n_boot=1000, units=None,
markers=’o’, linestyles=’-‘, dodge=False, join=True, scale=1, orient=None, color=None,
palette=None, errwidth=None, capsize=None, ax=None, **kwargs)
Parameters:
- x, y: It is used for taking input of a long-form of data.
- hue: It is used for color encoding of the graph.
- data: It takes the input of datasets that we plot.
- estimator: It is a statistical function to estimate within each categorical bin.
- n_boot: It is a number of bootstrap iterations that we use when computing confidence intervals is done.
- maker: It is used for each of the hue levels.
- errwidth: It is used for setting the thickness of error bar lines.
Examples
import pandas as pd
import numpy as np
import matplotlib.pyplot as plt
import seaborn as sns

data=sns.load_dataset('exercise')
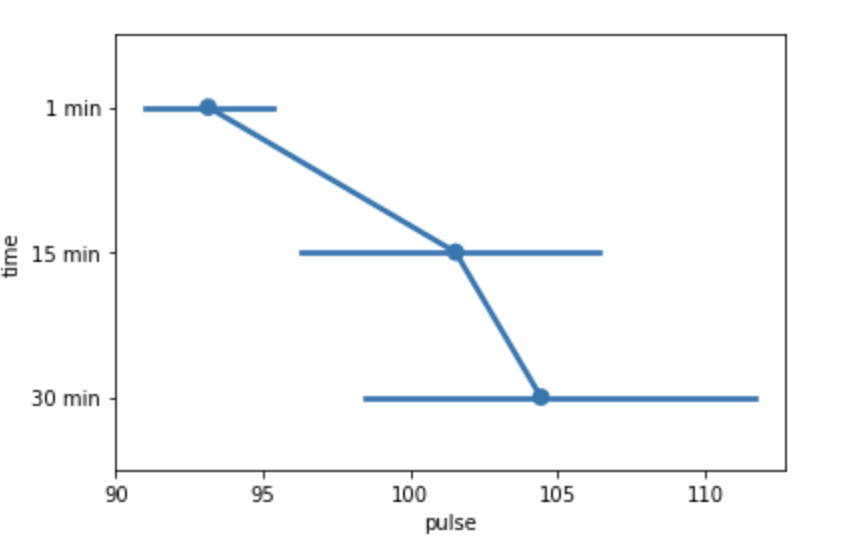
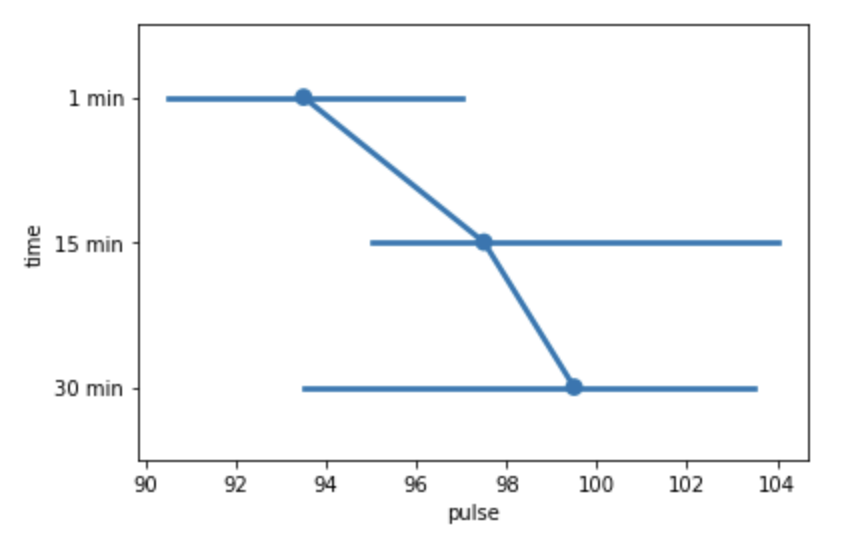
sns.pointplot(x="pulse", y="time", data=data)Output
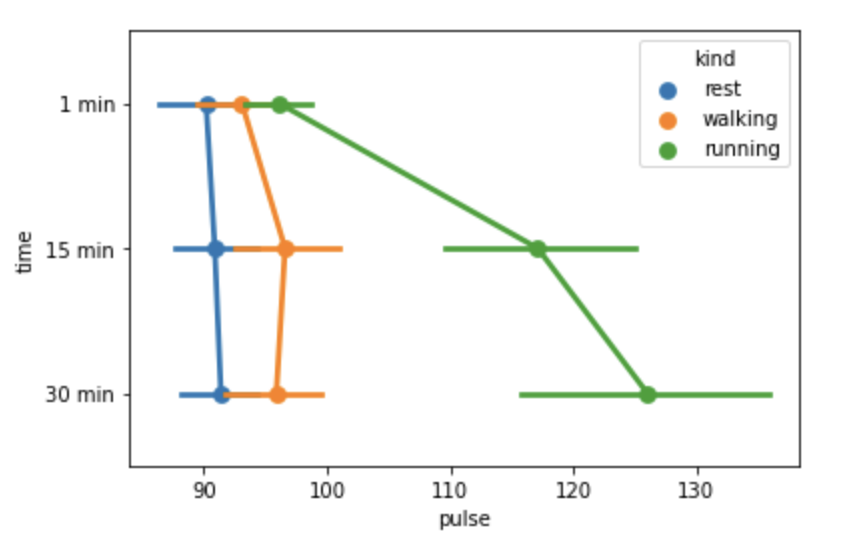
sns.pointplot(x="pulse",y="time",hue ="kind", data=data)Output
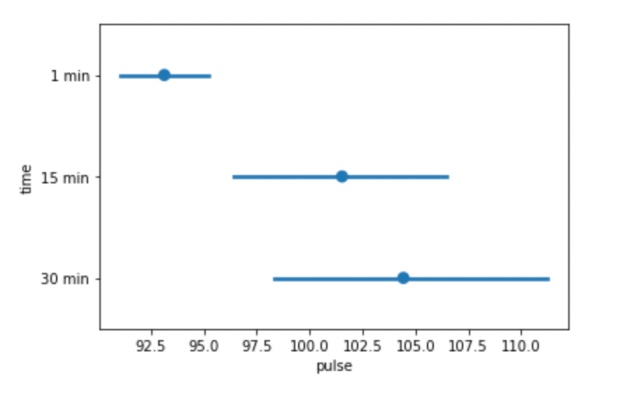
sns.pointplot(x="pulse",y="time", data=data, join=False)Output
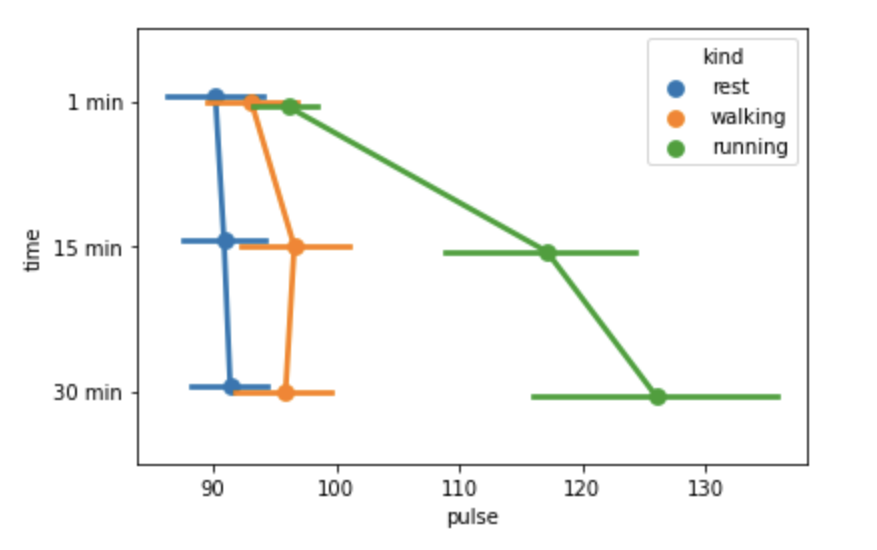
sns.pointplot(x="pulse",y="time",hue="kind",data=data, dodge=True)Output
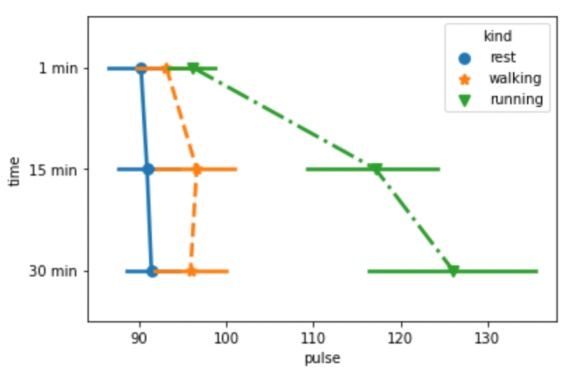
sns.pointplot(x ="pulse",y ="time",linestyles=['-','--','-.'], markers=['o','*','v'],
hue ="kind",data = data)
Output
sns.pointplot(x="pulse", y="time", data=data, estimator=np.median)Output
- Log in to post comments