The standard normal distribution is a special case of the normal distribution where μ=0, σ2=1. If is often essential to normalize data prior to the analysis. A random normal variable with mean μ and standard deviation μ can be normalized via the following:
Standard Normal Distribution Graph:
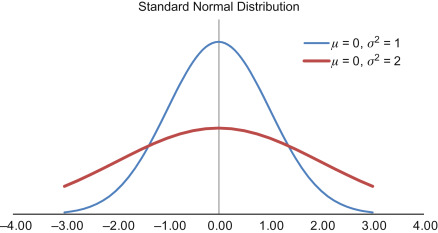
The standard normal distribution is a normal distribution with a mean of zero and standard deviation of 1. The standard normal distribution is centered at zero and the degree to which a given measurement deviates from the mean is given by the standard deviation.
For the standard normal distribution, 68% of the observations lie within 1 standard deviation of the mean; 95% lie within two standard deviation of the mean; and 99.9% lie within 3 standard deviations of the mean. To this point, we have been using "X" to denote the variable of interest (e.g., X=BMI, X=height, X=weight).
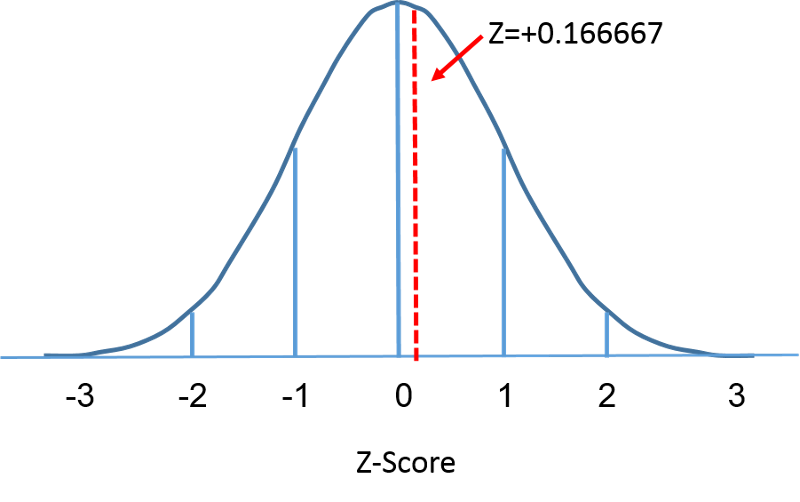
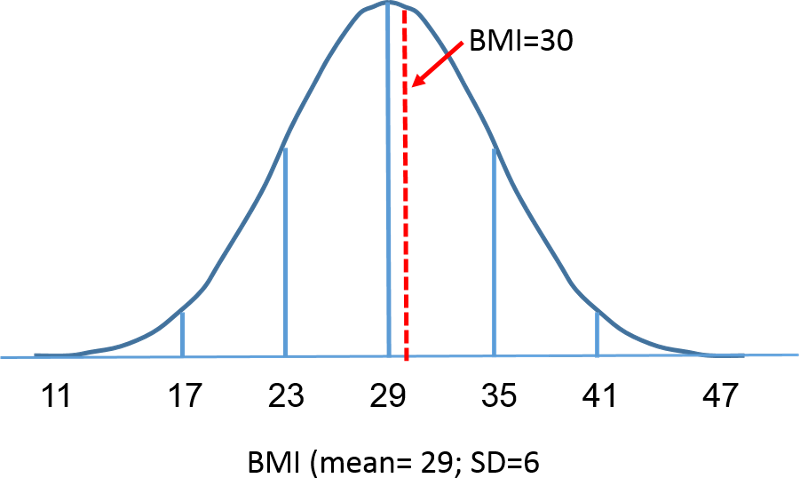
However, when using a standard normal distribution, we will use "Z" to refer to a variable in the context of a standard normal distribution. After standarization, the BMI=30 discussed on the previous page is shown below lying 0.16667 units above the mean of 0 on the standard normal distribution on the right.
Since the area under the standard curve = 1, we can begin to more precisely define the probabilities of specific observation. For any given Z-score we can compute the area under the curve to the left of that Z-score. The table in the frame below shows the probabilities for the standard normal distribution.
Examine the table and note that a "Z" score of 0.0 lists a probability of 0.50 or 50%, and a "Z" score of 1, meaning one standard deviation above the mean, lists a probability of 0.8413 or 84%. That is because one standard deviation above and below the mean encompasses about 68% of the area, so one standard deviation above the mean represents half of that of 34%. So, the 50% below the mean plus the 34% above the mean gives us 84%.
Properties of a normal distribution
- The mean, mode and median are all equal.
- The curve is symmetric at the center (i.e. around the mean, μ).
- Exactly half of the values are to the left of center and exactly half the values are to the right.
- The total area under the curve is 1.
- Log in to post comments